Physical Position
The MineHub Physical Position Report offers a comprehensive, real-time, and interactive view of your material inventory. It focuses on projected end-of-month balances, while also allowing you to drill down into granular transaction details. This Report is crucial for long-term planning, financial forecasting, and managing material commitments with precision.
Getting Started: Accessing and Using Your Report
This section guides you on how to access your report and use its key features to tailor the information to your needs.
Accessing the Report
You can navigate to the report from the main application menu:
- Select REPORTS on the right side of the top menu.
- Then, click on Physical position.

Using Filters and View Options
This report features specific filters and view options to help you customize the data displayed.
Available Filters and Options:
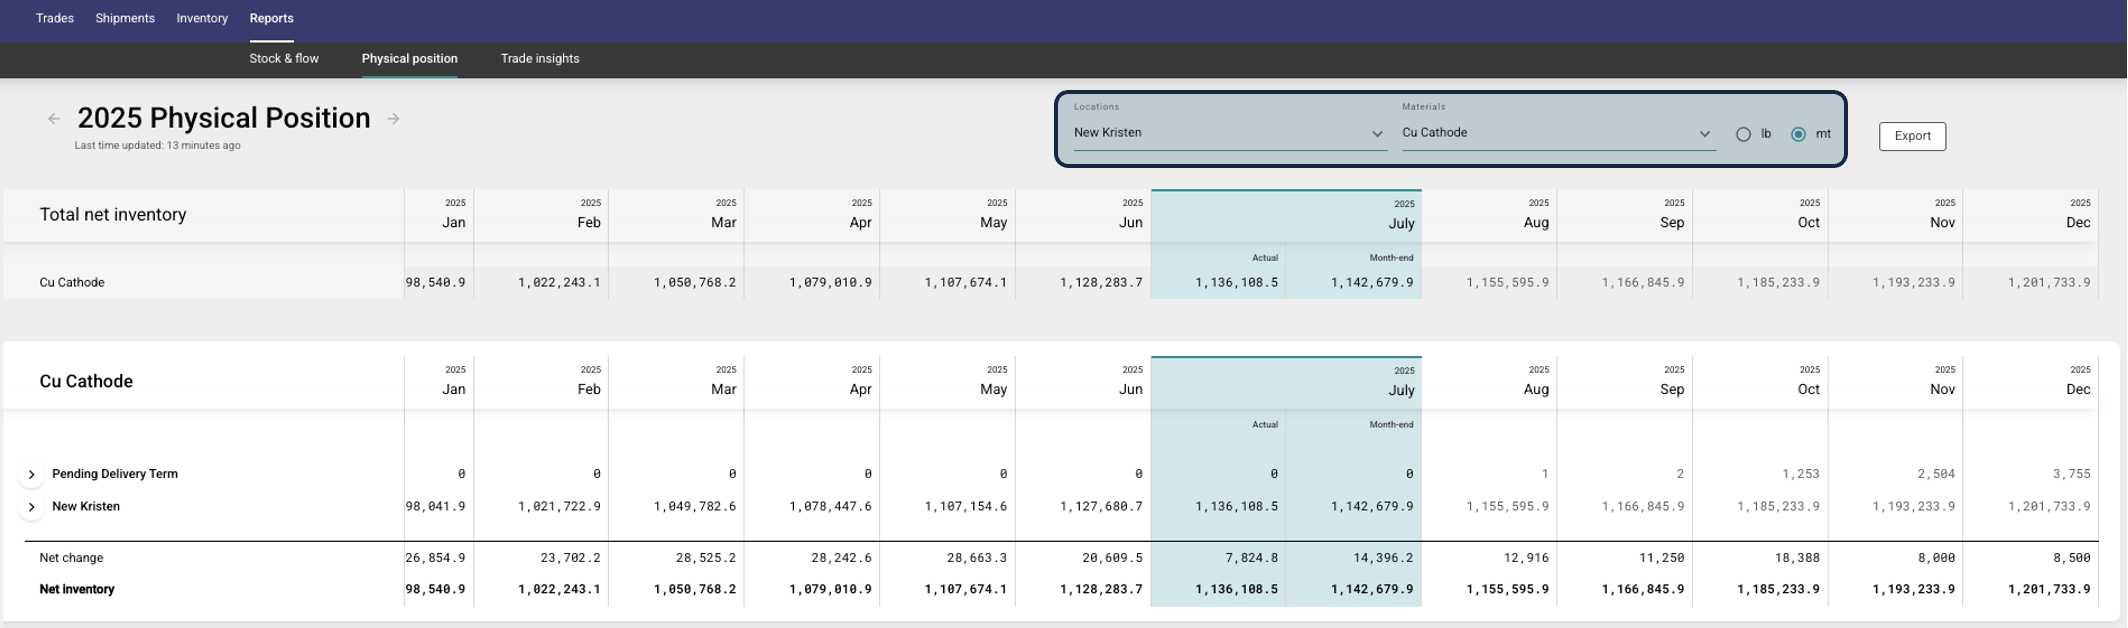
- Locations: Filter data by specific inventory locations (e.g., "New Kristen"). You can select one or multiple locations to narrow down results.
- Materials: Filter data by specific material types (e.g., "Cu Cathode"). You can select one or multiple materials.
- Units: Toggle between different units of measurement, such as "mt" (metric tons), if available.
Interacting with the Report: Expanding Data for Deeper Insights
The report is designed to be interactive, allowing you to drill down from a high-level summary to granular transaction details.
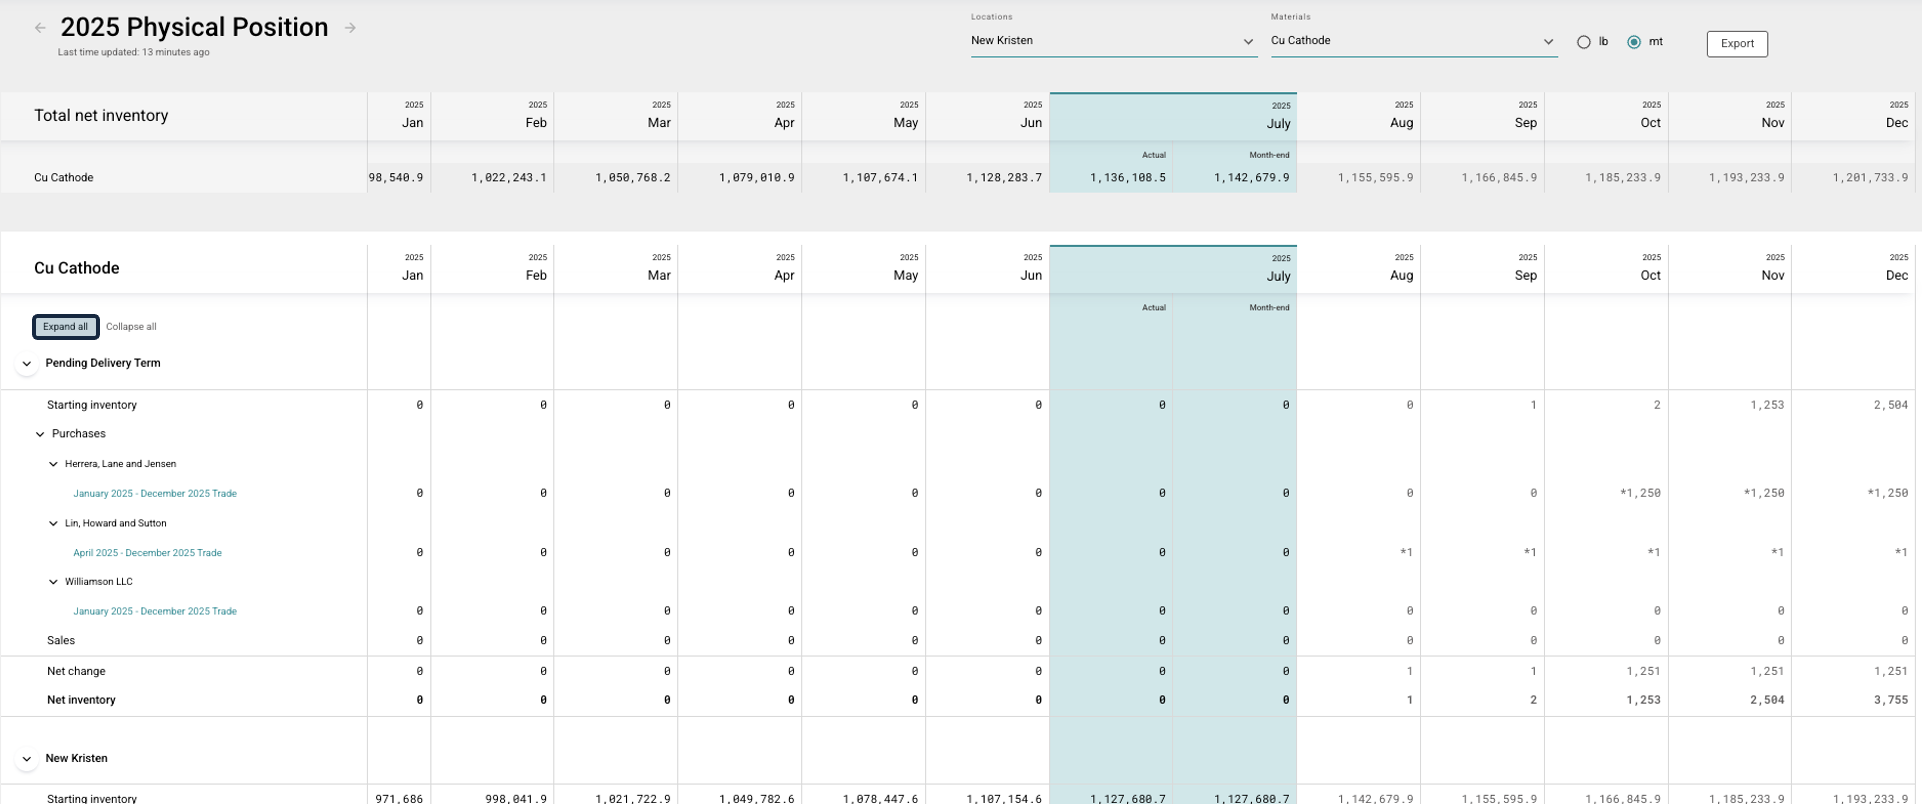
1. Hierarchical Data View & Expansion
The report presents data in a hierarchical structure. You can expand or collapse rows to reveal or hide underlying details.
- How to Expand/Collapse:
- Look for the right-pointing arrow (
>) next to a row item (e.g., next to a Material or Location). Clicking this arrow expands the row. - Once expanded, the arrow will change to a down-pointing arrow (
v). Clicking it again will collapse the row.
- Look for the right-pointing arrow (
- Expand/Collapse All: For sections with many sub-items, you can use the "Expand all" and "Collapse all" links to manage the view efficiently.
2. Understanding the Levels of Detail
As you expand rows, you will uncover more specific layers of your inventory data:
Top Level (e.g.,
Cu Cathode): This shows the total inventory for a specific material, broken down by major categories like inventory at a specific Location (e.g.,New Kristen) and future commitments underPending Delivery Term.Second Level (e.g., Expanding
New Kristen): This reveals the components of the inventory balance at that location, including:Starting Inventory: The balance at the beginning of the period.Purchases: All incoming material from purchase agreements.Sales: All outgoing material from sales agreements.Transfers: Material moved between locations, broken down intoInboundandOutbound.Production: New material generated.In-transit inventory: Material that has shipped but not yet been received.
Third Level (e.g., Expanding
PurchasesorSales): This provides the most granular view, showing the specific Counterparties or Trades that make up that category (e.g.,Adam's Group,Williamson LLC,January 2025 - December 2025 Trade). This allows you to trace inventory movements back to individual transactions.
3. "Actual" vs. "Month-end" Columns
For the current reporting period, you will notice two distinct columns for your inventory figures:
Actual: This column represents the real-time physical position data as of the moment the report was generated. It provides the most up-to-date snapshot of your current inventory.Month-end: This column represents the projected physical position at the end of the current month. It calculates this figure by taking theActualvalue and factoring in all known future transactions scheduled within that month.
Key Metrics within Physical Position Report
Total Net Inventory (Monthly View)
- Total Net Inventory: Provides a projected end-of-month inventory balance based on all known inbound, outbound, and internal movements. This section summarizes your overall material position for each month. This is crucial for long-term strategic planning, financial forecasting, and assessing your future stock positions. It aids in making informed decisions about purchasing, sales, and production volumes.
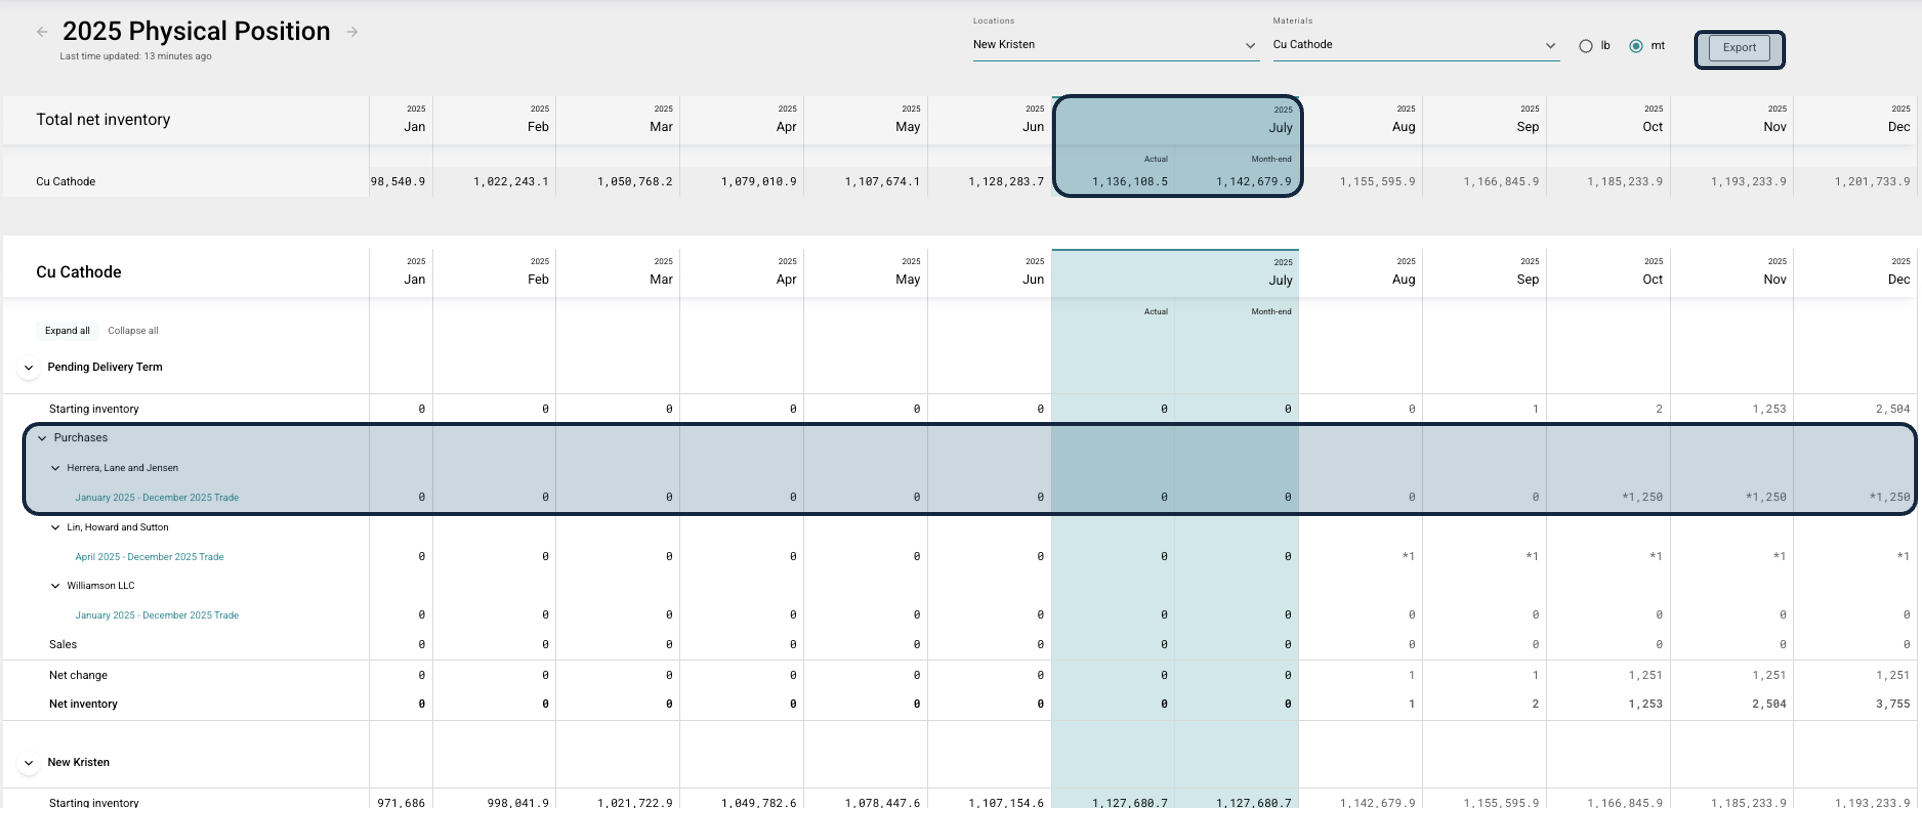
Pending Delivery Term (Monthly View)
- Pending Delivery Term: Displays expected material inflows from purchases and starting inventory, broken down by supplier/transaction for each month. This section provides a detailed look at your anticipated supply. This gives you visibility over expected material flows which haven’t been assigned to a particular order yet (for example, vessel shipments which have been booked but aren’t in transit).
Need a copy of your report data? Use the Export button, located in the top right corner of the page, to generate a CSV file of the current report information.