Trade Insights
The MineHub Trade Insight Dashboard is designed to provide deep visibility into your trade operations, helping you make data-driven decisions in the complex metals sector. This guide explains how you can access and understand key insights, including:
- Visualize the flow of orders and deliveries
- Analyze the distribution of shipments over time
- Track the timing and frequency of deliveries
- Analyze material breakdown (by product, grade, or brand)
- Measure transit times by route
- Evaluate supplier performance with OTIF scores
Getting Started: Accessing and Using Your Dashboard
This section guides you on how to access your Trade Insights Dashboard and use its key features to tailor the information to your needs.
Accessing the Dashboard
You have two primary ways to navigate to the Trade Insights Dashboard:
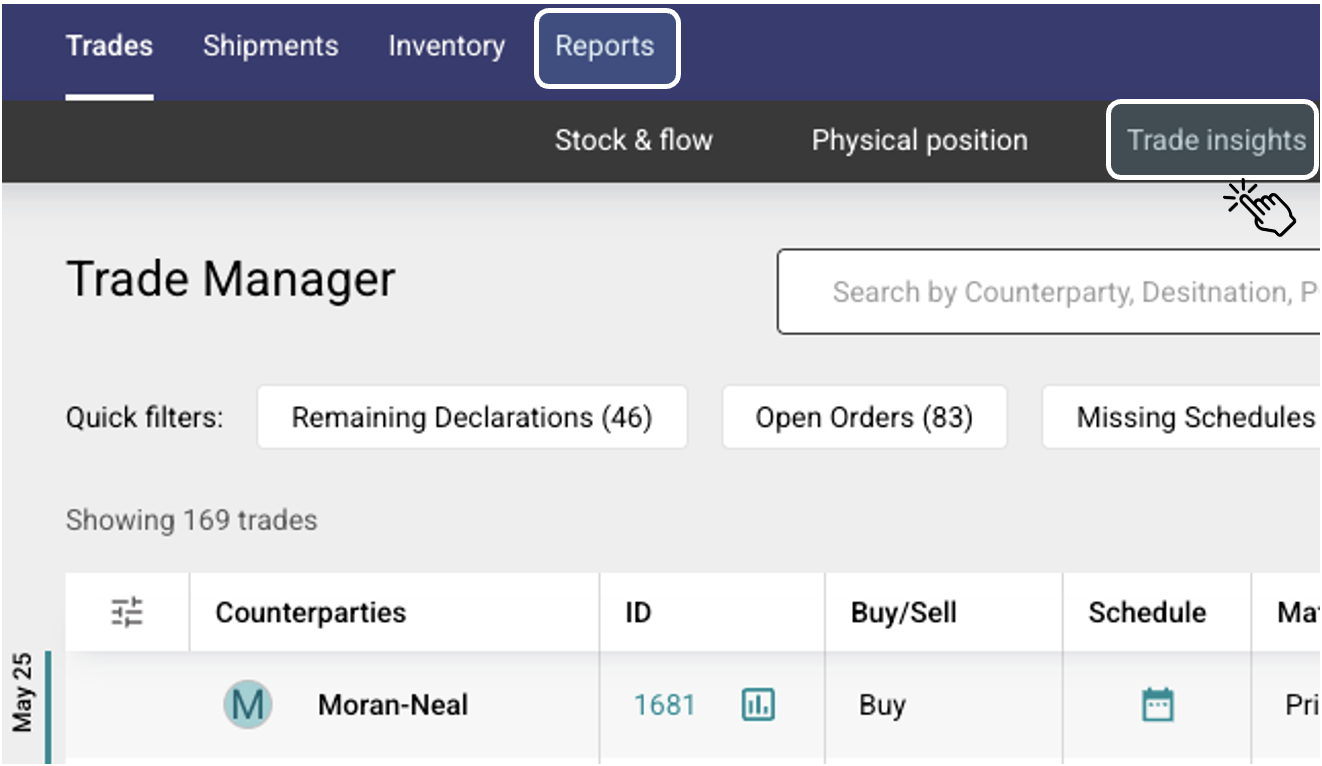
- Directly from a Specific Trade (Trade Manager Home Page):
- On the Trade Manager home page, find the trade you wish to analyze.
- Click the TRADE INSIGHTS button located next to the trade's ID.
- This will take you directly to the Trade Insights Dashboard, pre-filtered for that specific trade.

- Via the Main Menu (Trade Manager Home Page):
- From the top menu on the Trade Manager home page, select REPORTS.
- From the dropdown or subsequent menu, choose TRADE INSIGHTS.
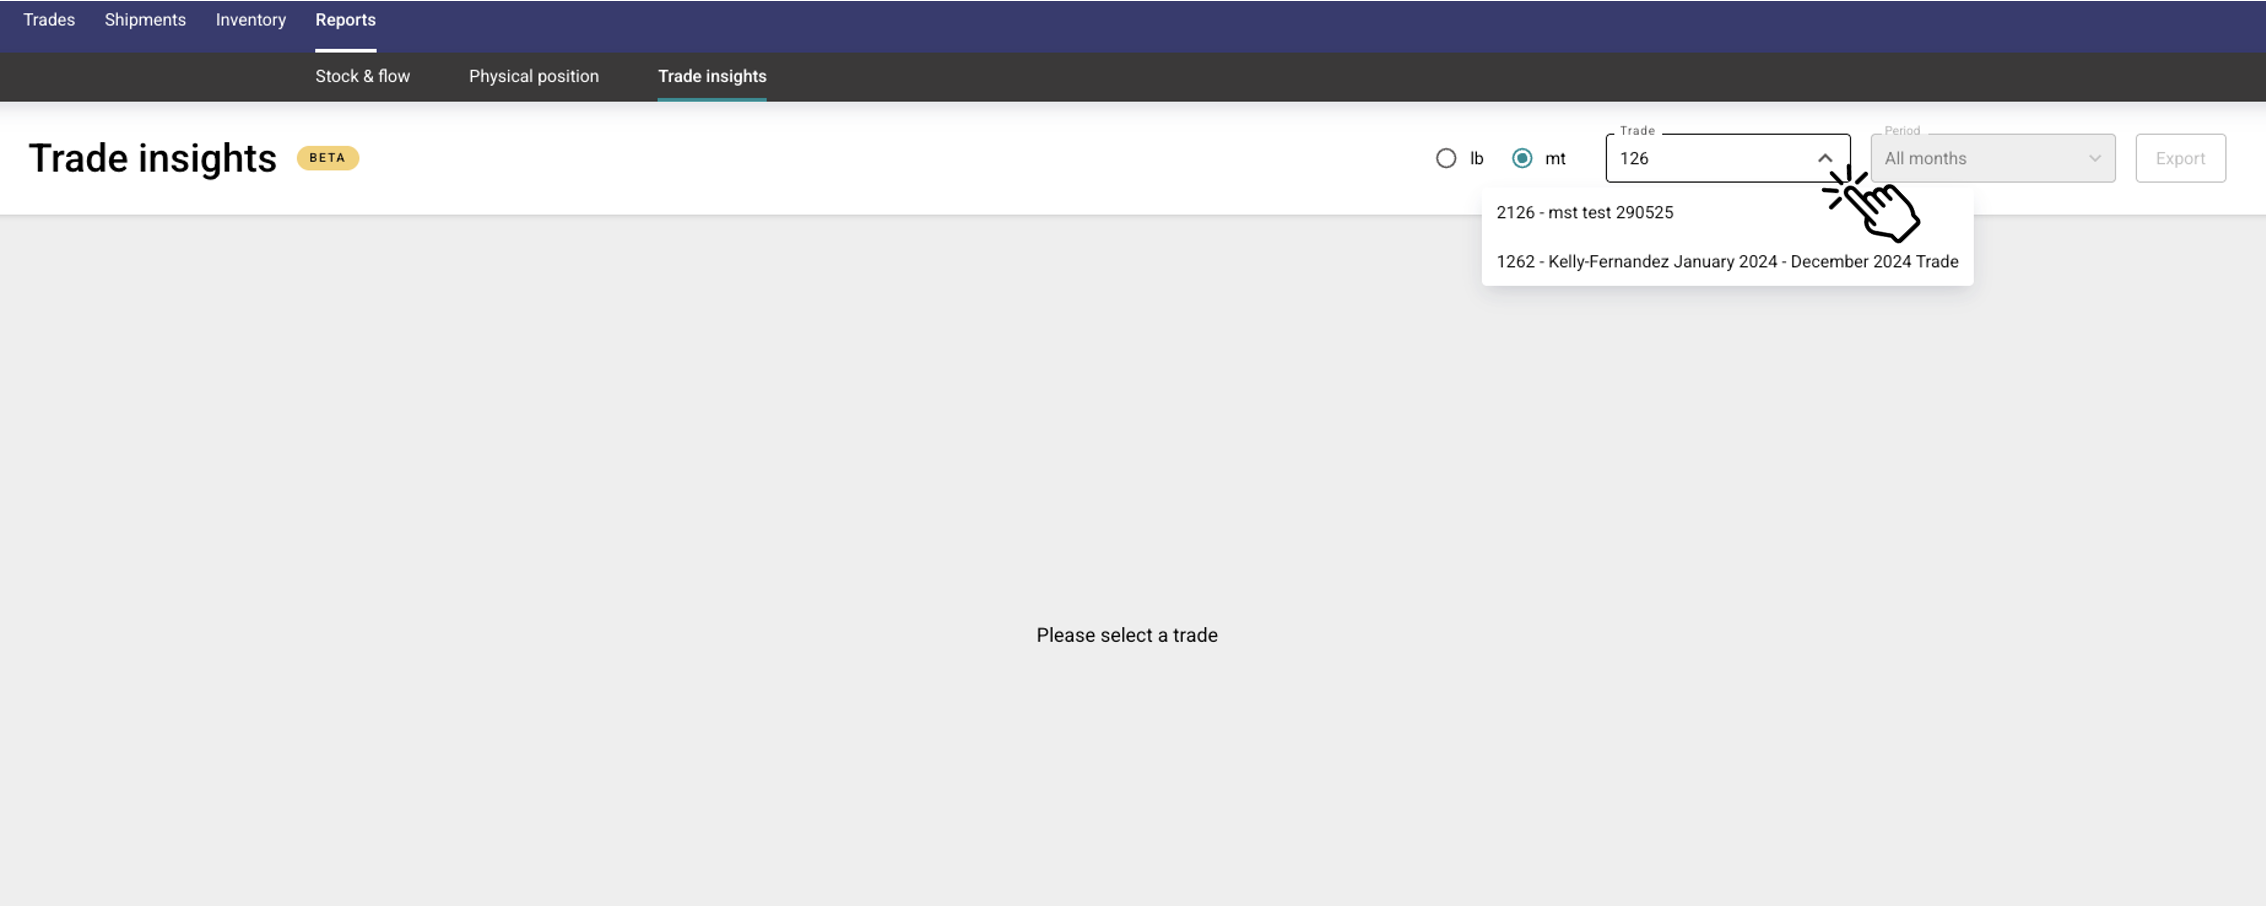
- Once the dashboard loads, you can use the filter in the upper right corner to:
- Search for a specific trade by its name or ID.
- Select a trade from the dropdown list.
Using Filters and Interacting with Charts
The Trade Insights Dashboard features specific filters for certain visualizations and interactive elements on all charts to help you dive deeper into your data.
Available Filters:
- For Transit Time Metrics:
- You can filter the transit time data by DESTINATION LOCATION or ORIGIN LOCATION.
- If no location is selected, data for all locations will be shown.
- You can select one or more locations to narrow down the results. The charts will update to display only the selected locations.

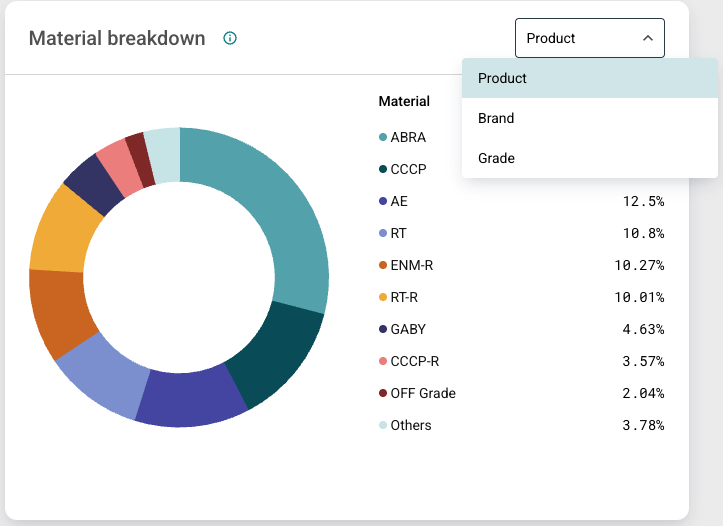
- For Material Breakdown Reporting:
- Use the available filter to view the material breakdown by PRODUCT, GRADE, or BRAND.
- The corresponding pie chart will dynamically update based on your filter selection.
Interacting with Charts:
- Hover for Details: Move your mouse cursor over any data point, bar, or segment in a chart. A tooltip will appear, providing more specific information and exact values for that data element.
- Info Icons: Every chart is accompanied by an INFO icon (often a small "i"). Click on this icon to read a more detailed explanation of what the chart represents and how to interpret its data.

Need a copy of your dashboard data? Use the Export button, located in the top right corner of the page, to generate a PDF file of the current dashboard information, suitable for printing or saving.
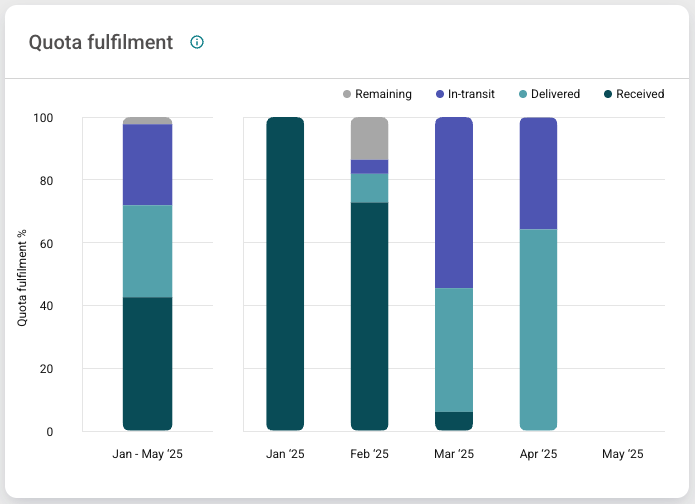
Order Tracking Overview
What it does:
Visualizes the flow of booked orders against deliveries received, providing you with a real-time view of order fulfillment over the lifetime of a contract. This chart specifically shows the amount of material in each status (e.g., booked, in-transit, delivered, received, allocated, remaining) as a percentage of the month's quota.
Why it matters:
Metals trading is high-value, high-volume, and high-risk. Tracking material movement against contract terms allows you to detect discrepancies early, enforce commercial terms more effectively, and mitigate delivery risk before it compounds.
Shipment Distribution
What it does:
Visualize your deliveries relative to their quota month. The visualization groups the percentage of material by shipment arrival date relative to the quota month.
Why it matters:
Distribution patterns reveal underlying operational realities like supplier bottlenecks and consistent delays. This empowers you and your team to diversify strategies, negotiate more favorable terms, and balance your supply base proactively.
![]()
Delivery Cadence Analysis
What it does:
Tracks the timing and frequency of shipments throughout the delivery month relative to an even delivery par rate. This helps you to determine whether a supplier is delivering on a regular cadence (excluding vessels).
Why it matters:
Deliveries impact inventory, and uneven shipping patterns can impact your team's balance sheet, cash flow, and production schedule. Understanding supplier delivery cadence will help you to forecast disruptions, recalibrate inventory buffers, and negotiate contracts based on real performance data, not assumptions.
The following chart illustrates the percentage of the month's quota delivered versus the number of days into the quota month:
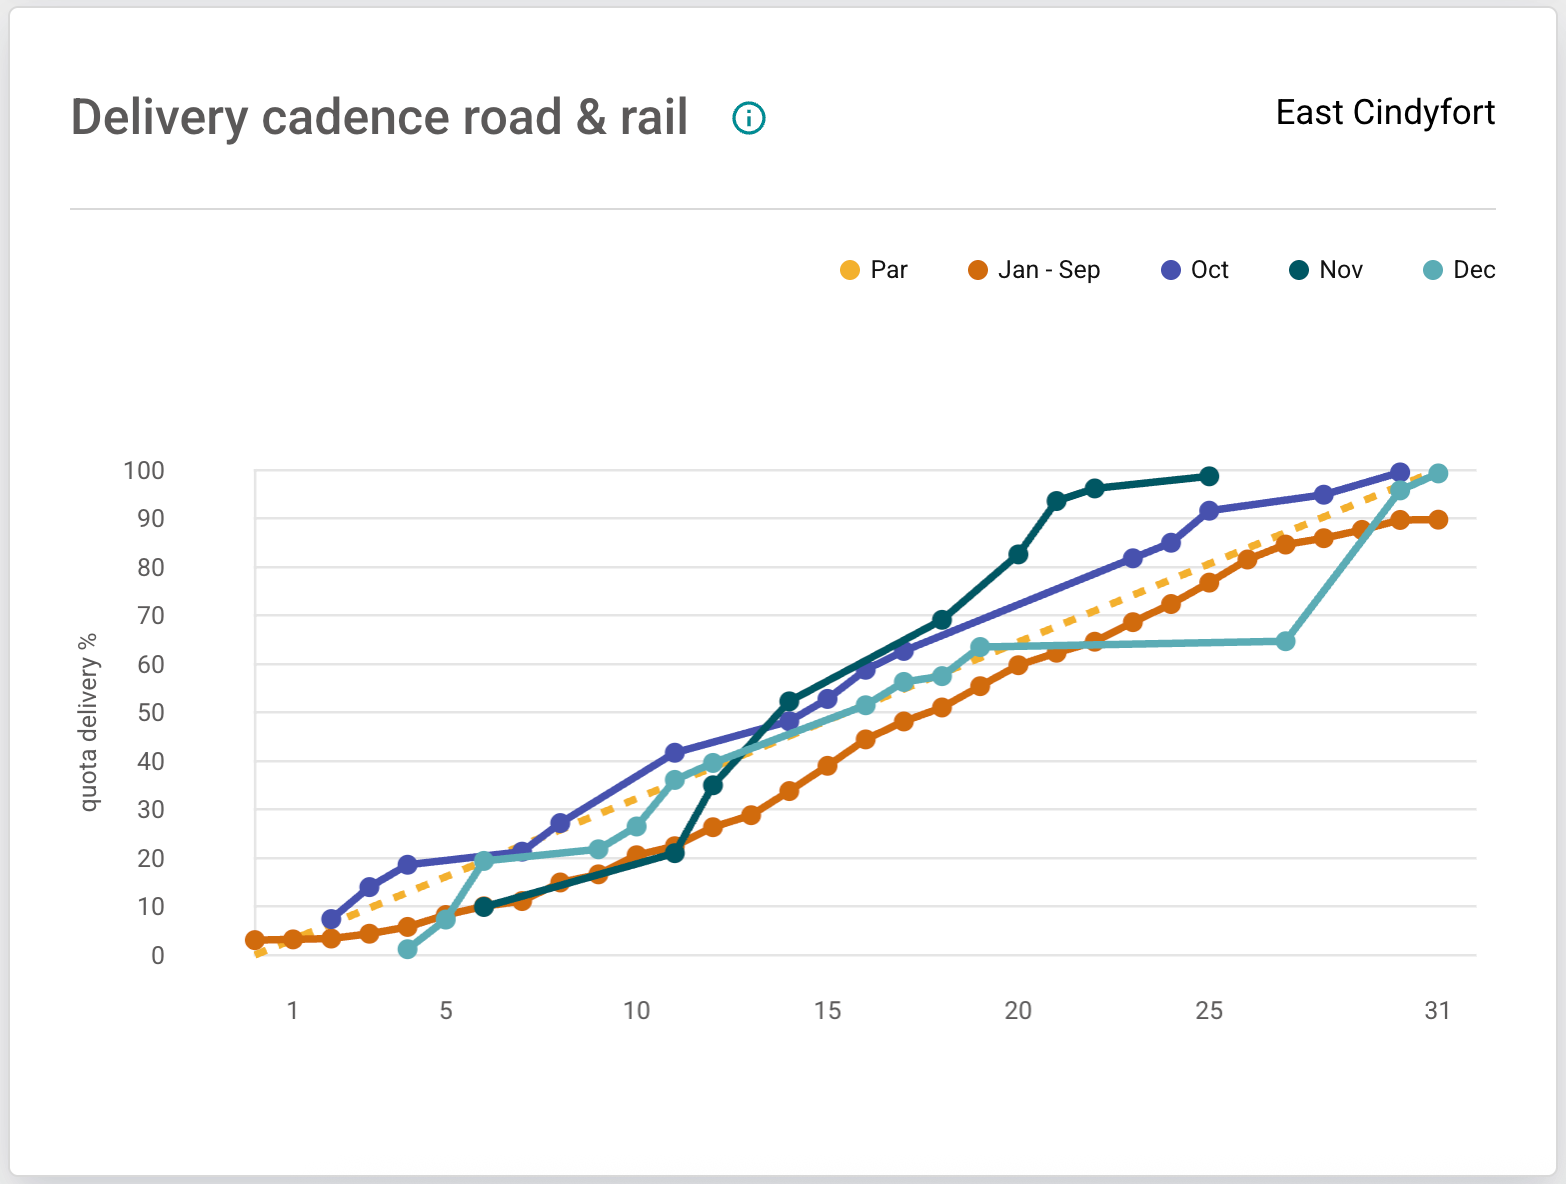
MineHub measures delivery cadence specifically for truck and rail deliveries only. Deliveries by other conveyance types may not appear in this analysis.
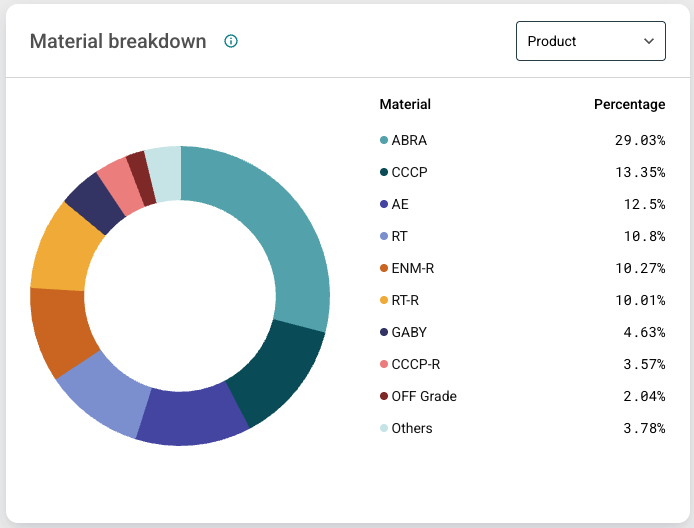
Material Breakdown Reporting
What it does:
Analyzes shipment volume by product, grade or brand type over the life of the contract. The chart shows the percentage of delivered or in-transit material, grouped accordingly.
Why it matters:
In metals, chemistry matters, and visibility to the product mix being delivered gives you the insights needed to ensure you are getting the right profile of material for your operations. Concentration also matters, and relying too heavily on a single supplier for a particular product creates risk. With MineHub’s analytics, you can visualize this risk and plan your demand accordingly.
The visualization below breaks down material by the selected grouping (Product, Grade, or Brand):
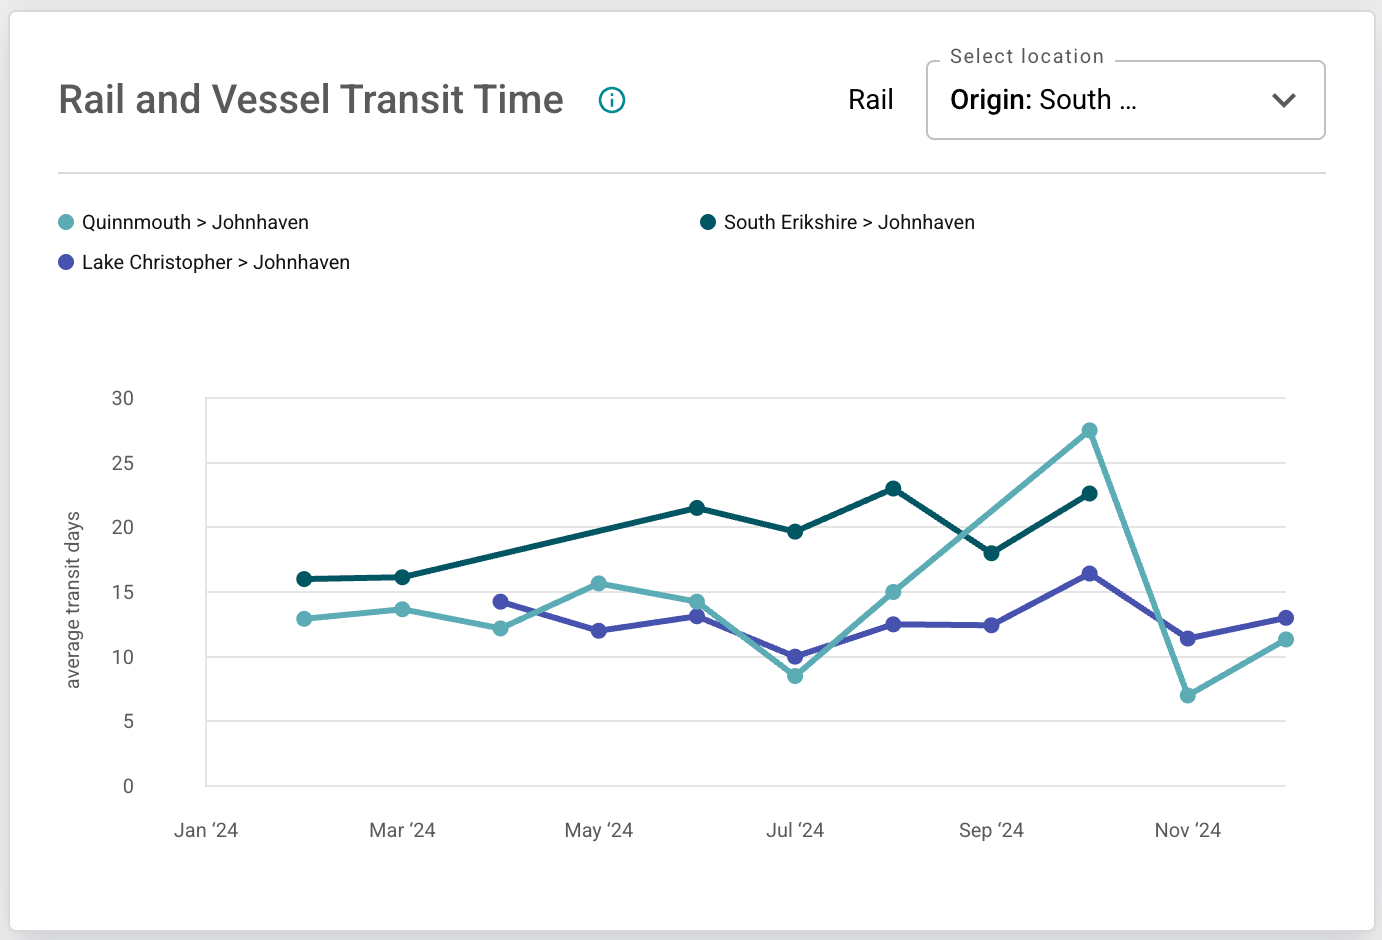
Transit Time Metrics
What it does:
Measures the actual time your shipments spend in transit, segmented by route and conveyance type (excluding trucks).
Why it matters:
With tightening freight markets and geopolitical disruptions impacting global logistics, knowing actual transit times is critical for you to plan inventory, customer deliveries, and financing terms. MineHub provides this visibility without reliance on external tracking providers.
This chart compares the average transit time of rail and vessel shipments, typically grouped by route or conveyance type:
OTIF (On-Time-In-Full) Performance Scores
What it does:
Calculates and displays supplier delivery performance, measuring both timing and completeness. It specifically tracks the volume of material delivered on time, early, or late, as defined by the Incoterm (e.g., DDP deliveries are measured by arrival date).
Why it matters:
On-Time-In-Full is a leading indicator of supplier reliability. MineHub's OTIF reporting arms your team with objective, trusted data to inform supplier scorecards, contract negotiations, and long-term strategic sourcing decisions.

The OTIF Score is calculated as: (On-time deliveries + Early deliveries) / Monthly quota