Stock & Flow
The MineHub Stock & Flow Report offers a granular, day-by-day breakdown of inventory changes for a selected month. This detailed view includes starting inventory, overall material movements, inbound and outbound shipments, production impact, daily net change, end-of-day net inventory, and days inventory on hand. It provides crucial insights into the daily dynamics of your material flows, enabling proactive management and operational optimization.
Getting Started: Accessing and Using Your Report
This section guides you on how to access your report and use its key features to tailor the information to your needs.
Accessing the Report
You can navigate to the report from the main application menu:
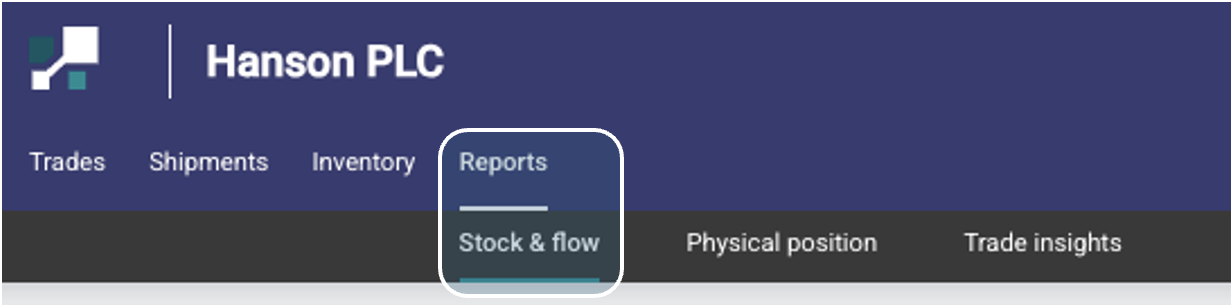
- Select REPORTS on the right side of the top menu.
- Then, click on Stock & Flow.
Using Filters and View Options
This report features specific filters and view options to help you customize the data displayed.
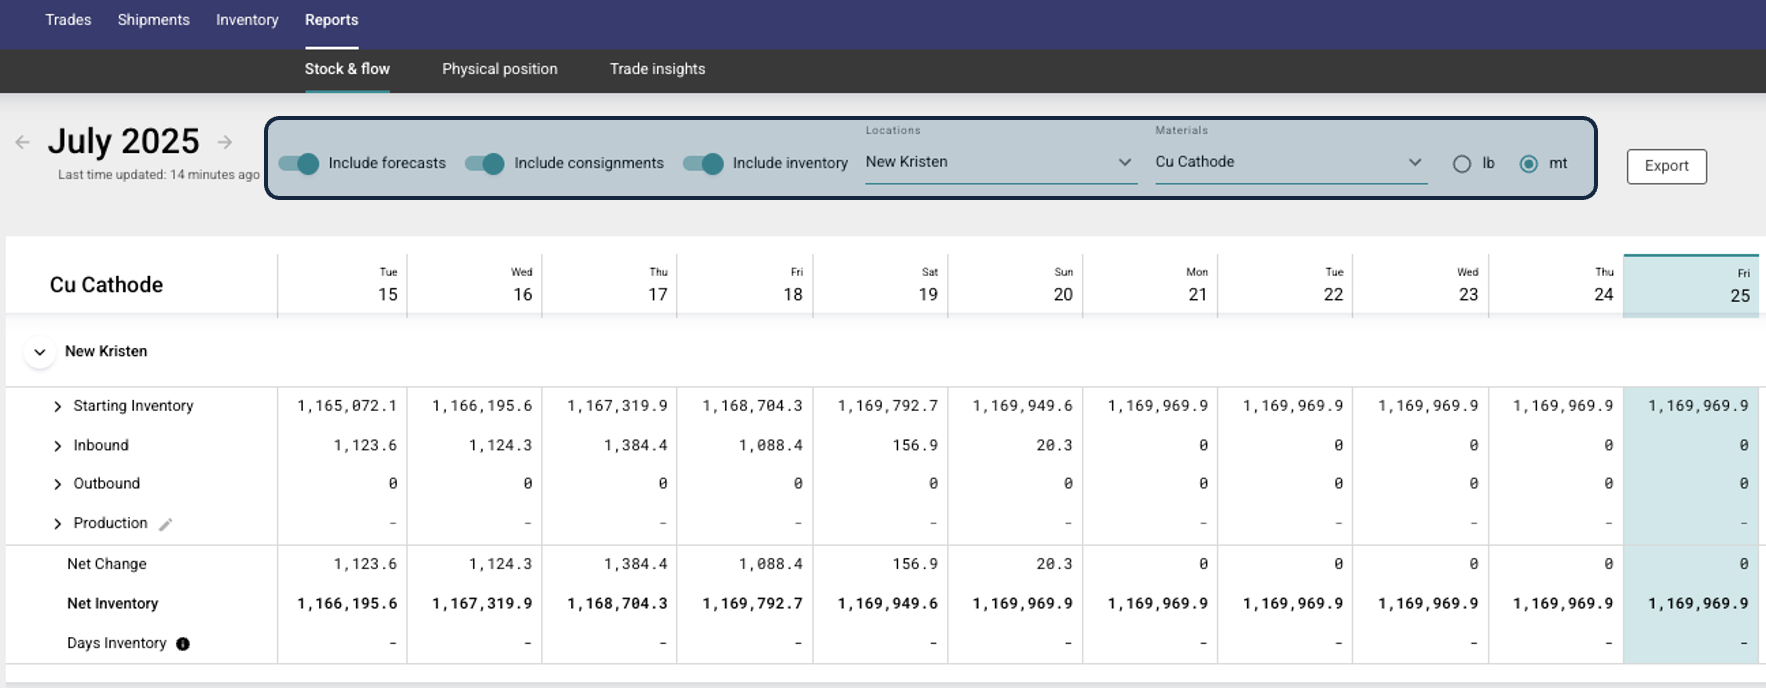
Available Filters and Options:
Include forecasts: This toggle allows users to include or exclude planned inventory movements in their daily projections.
- What are forecasted shipments? These are quantities that have been scheduled in the Trade module but are not yet associated with a booked shipment or a firm appointment. They represent planned or expected stock movements.
- How do they impact your view? When enabled, these forecasted amounts are added to the daily calculations in the Stock & Flow view. This provides a more complete, forward-looking projection of your stock levels.
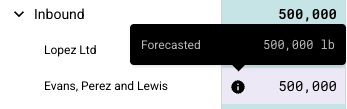
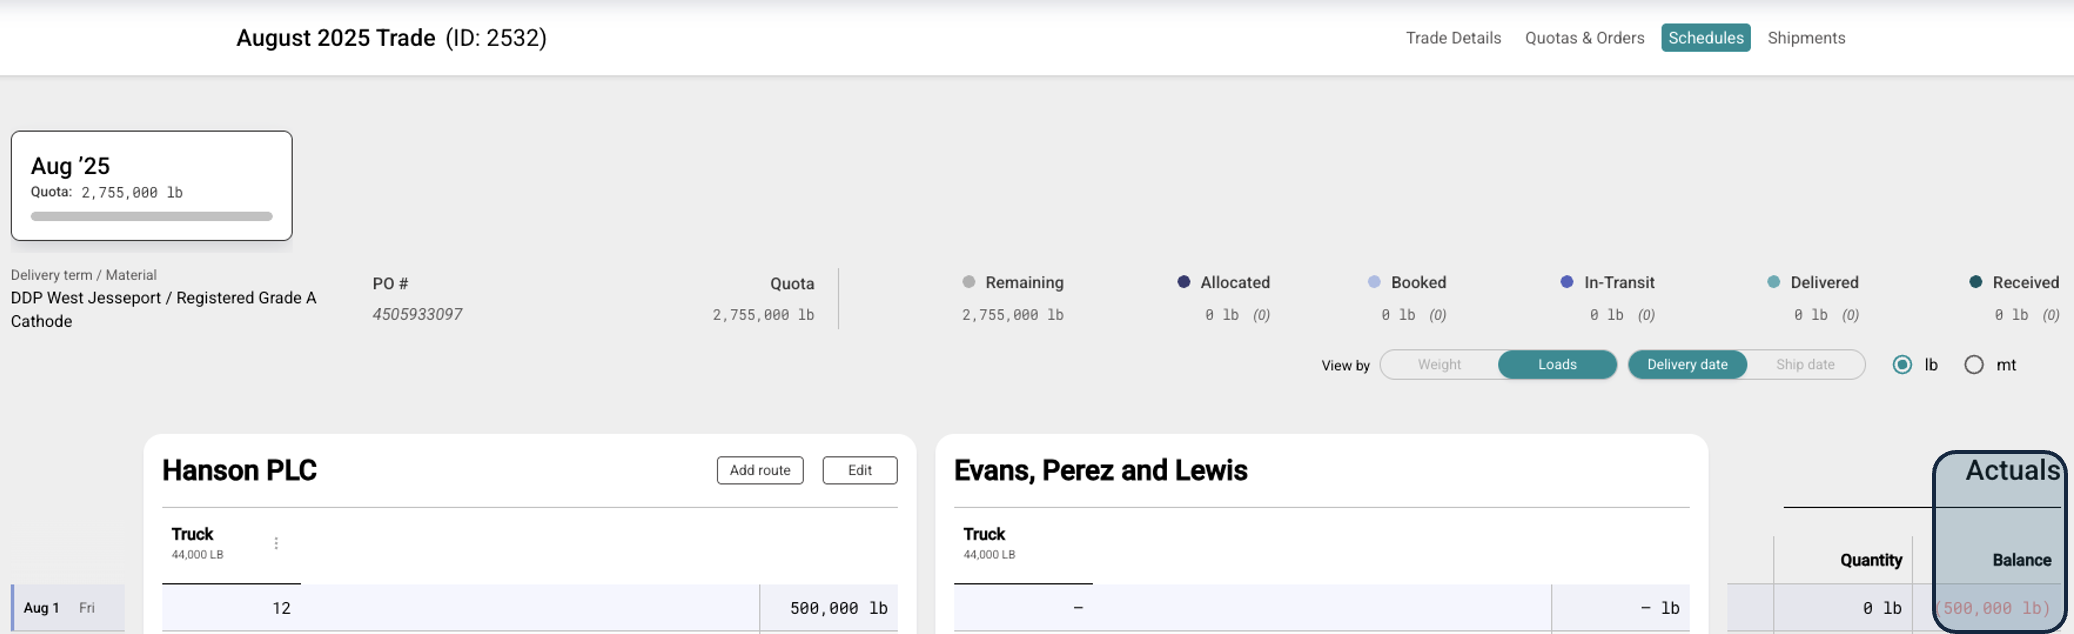
- Example: In the image below, "Evans, Perez and Lewis" has a forecasted inbound shipment of 500,000 lb for August 1st. This number originates from a "Balance" quantity in the corresponding Trade schedule (e.g., "August 2025 Trade ID: 2532"). By enabling "Include forecasts," this amount becomes visible in the Stock & Flow daily view, clearly labeled as "Forecasted" when you hover over it.
Include consignments: This option allows you to include or exclude consigned stock in the "Stock & flow" daily calculations.
Include inventory: [Location Name]: This option specifically allows you to include or exclude inventory from a named location in the "Stock & flow" daily calculations.
Locations: Filter data by specific inventory locations (e.g., "New Kristen"). You can select one or multiple locations to narrow down results.
Materials: Filter data by specific material types (e.g., "Cu Cathode"). You can select one or multiple materials.
Units: Toggle between different units of measurement, such as "mt" (metric tons), if available.
Daily Stock & Flow Analysis:
The Stock & Flow view provides a granular, day-by-day breakdown of your inventory movements and balances for a selected month.
- Use the month selector in the top right corner to navigate to specific days within that month.
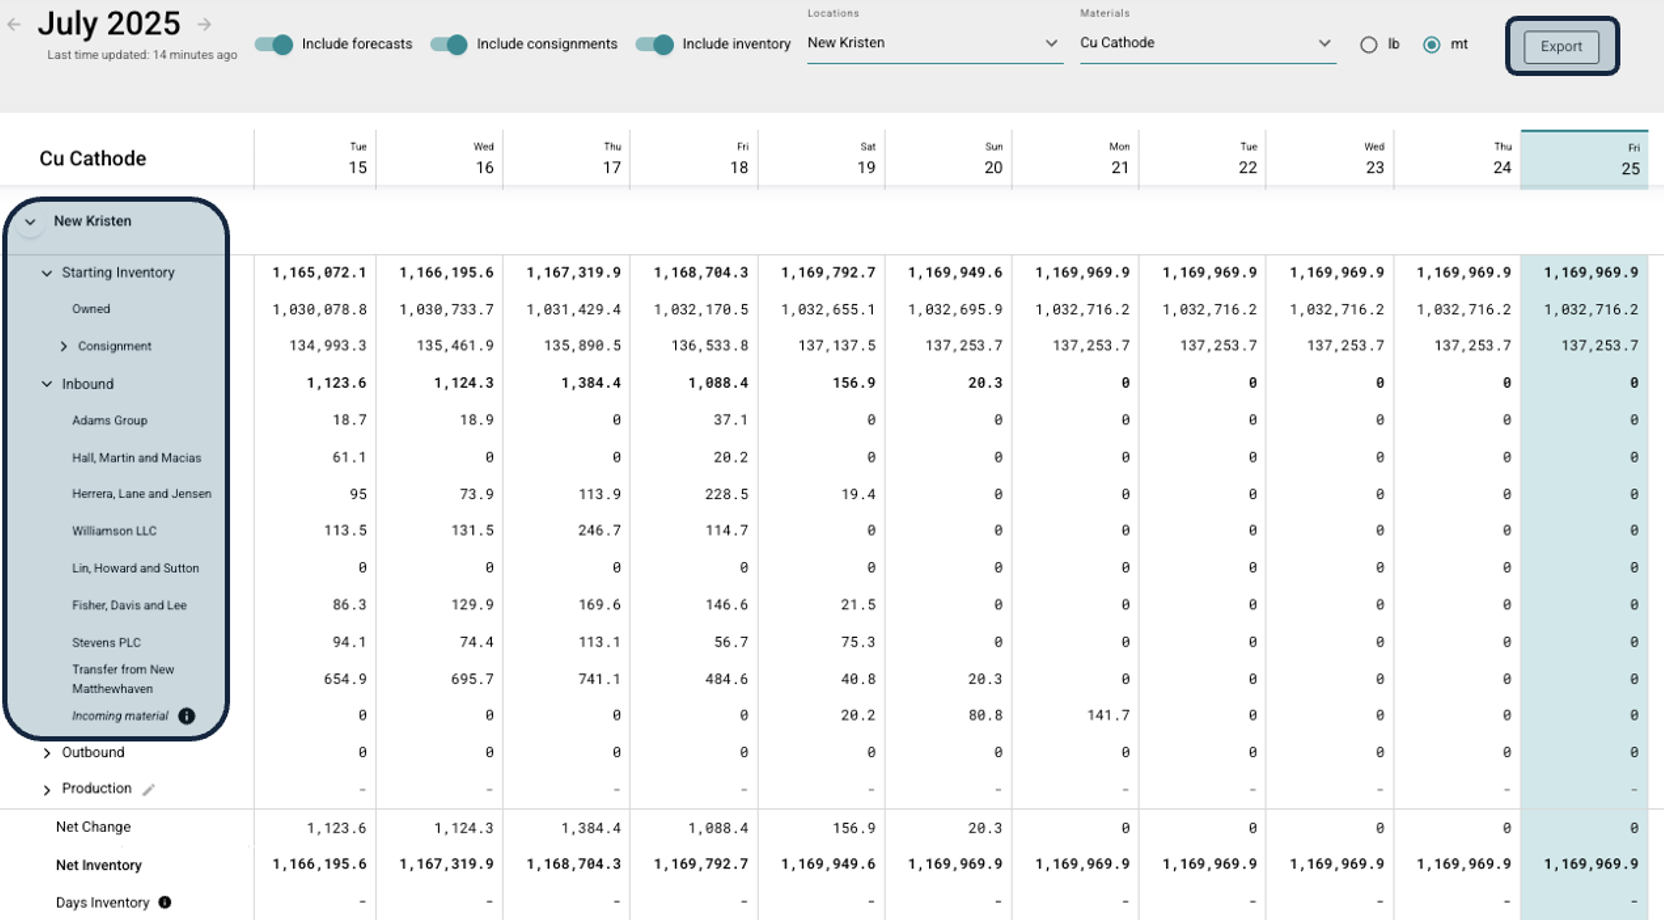
Need a copy of your report data? Use the Export button, located in the top right corner of the page, to generate a CSV file of the current report information.
Interacting with Expandable Data in the Stock & Flow View
The report provides a detailed breakdown of your inventory movements and positions. To help manage the extensive data, key sections are expandable, allowing you to drill down into more granular information or collapse sections to simplify your view.
How to Identify Expandable Data:
Look for a chevron icon (either > or ⌄) next to a row label:
- A
>(right-pointing chevron) indicates that the section is currently collapsed and contains more detailed information. - A
⌄(down-pointing chevron) indicates that the section is currently expanded and its detailed information is visible.
How to Expand or Collapse Sections:
To expand or collapse any section, simply click on the chevron icon or the row label itself.
Examples from the Stock & Flow View:
Location-Level Expansion (e.g., "New Kristen"):
- At the top level, your selected location (e.g., "New Kristen") has a chevron icon next to it.
- Action: Click this chevron to expand or collapse the entire detailed view for that location, including "Starting Inventory," "Net Change," "Net Inventory," and "Days Inventory."
Category-Level Expansion (e.g., "Consignment," "Inbound," "Outbound," "Production"):
- Within the location's data, specific categories such as "Consignment," "Inbound," "Outbound," and "Production" also feature chevron icons.
- Action: Clicking these chevrons will expand or collapse the specific sub-data for that category. For example, expanding "Inbound" might show individual inbound movements, or "Production" might show details of production batches, allowing you to see the components contributing to the summary numbers.
By utilizing these expandable sections, you can customize your view to focus on the information most relevant to your current analysis, improving clarity and efficiency.
Key Metrics within Stock & Flow
Key Daily Metrics within Stock & Flow:
- Starting Inventory: The initial balance of material at the beginning of each day.
- Overall: Represents the total material movements for the specific day, combining all inbound, outbound, and production activities.
- Inbound: Quantities of material arriving into inventory from external sources (e.g., purchases, incoming transfers).
- Outgoing: Quantities of material leaving inventory (e.g., sales, outgoing transfers, consumption).
- Production: Material added to or consumed from inventory through internal production processes. This reflects how internal operations affect stock levels.
- Net Change: The daily increase or decrease in inventory, calculated from the sum of inbound, outbound, and production activities.
- Net Inventory: The projected end-of-day inventory balance after all daily movements have been accounted for.
- Days Inventory: The number of days of future sales or production needs that can be covered by the current net inventory. This is a critical indicator of liquidity and operational buffer.